
Most billing companies will tell you what they charge. Very few will tell you what it’s actually costing you.
There’s a difference, and it matters more than most healthcare providers realize. The invoice from your billing vendor is one number. The true cost of your revenue cycle, once you factor in denied claims, rework hours, write-offs, and delayed reimbursements, is often an entirely different story.
At Vigilant Billing, we think you deserve to see both numbers clearly.
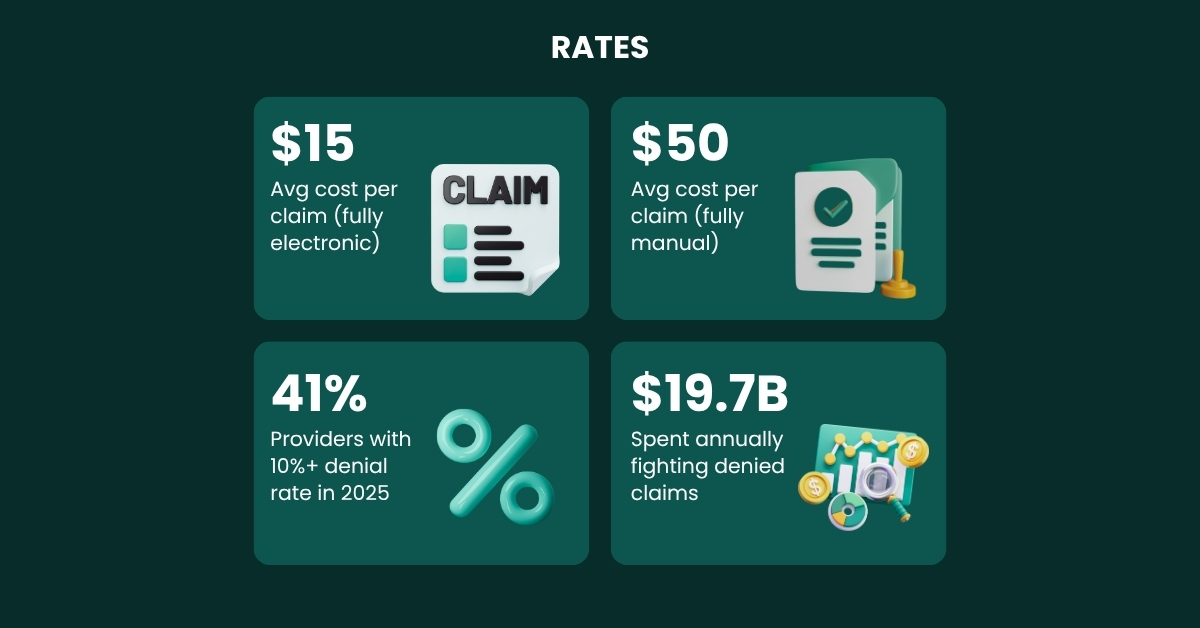
According to CAQH’s 2024 data, a fully manual billing workflow, including eligibility verification, claim submission, status inquiry, and payment, can cost close to $50 per claim. A fully electronic workflow runs around $15. The $35 gap per claim, multiplied across hundreds or thousands of monthly claims, is often the difference between a practice that grows and one that quietly bleeds revenue. In most cases, the provider has no idea it’s happening.
That’s not a billing problem. That’s a visibility problem.
Let Vigilant Billing make it simple for you. This blog breaks down exactly how medical billing rates per claim work: the pricing models, the real benchmarks, and the factors that drive costs up or pull them down, so that whatever decisions you make about your revenue cycle, you make them with full information.
What Does ‘Billing Rate Per Claim’ Actually Mean?
Before getting into numbers, it helps to be precise about what we’re measuring. The cost per claim in medical billing isn’t a single fee; it’s a composite of several different things that can be priced, charged, or absorbed in different ways depending on who’s doing your billing and how.
At the most basic level, the ‘cost per claim’ includes:
- The fee you pay your billing service or in-house billing staff to process and submit the claim
Time spent on eligibility verification before the claim is filedAny follow-up or status inquiry after submissionThe cost of handling denials, appeals, and resubmissionsTechnology costs, such as software, clearinghouse fees, and EHR integration
When people talk about billing rates per claim from a vendor, they’re usually referring to just the first item on that list. The full cost is often considerably higher, and understanding that distinction matters when you’re evaluating whether your current billing arrangement is working for you.
The Four Main Pricing Models:
Medical billing companies and in-house billing departments typically operate under one of four pricing structures. Each has its own logic, and each suits different practice situations.
| Pricing Model | Typical Rate | Best For | Watch Out For |
|---|---|---|---|
| Percentage of Collections | 4%–10% of revenue | Growing practices | Costs rise with revenue |
| Per-Claim Fee | $3–$10 per claim | Predictable volumes | No collection incentive |
| Hourly Rate | $20–$35/hour | Overflow billing help | Hard to control costs |
| Flat Monthly Fee | $1,000–$5,000+/mo | Large, stable practices | May not scale well |
- Percentage of Collections (4%–10%): This is the most common model, and it’s popular for a reason: it ties the billing company’s income to your income. If they collect more for you, they earn more. The trade-off is that as your practice grows and revenue increases, so do your billing costs.
- Per-Claim Fee ($3–$10 per claim): This model charges a fixed amount for each claim submitted, regardless of whether it gets paid. It’s transparent and easy to forecast. The downside of this pricing model is that because the billing company gets paid per claim rather than per dollar collected, there’s less financial incentive for aggressive follow-up on unpaid claims. This model works well for practices with high-volume, relatively straightforward claims where collection rates are already strong.
- Hourly Rate ($20–$35/hour): Less common for full billing operations, hourly rates are often used for overflow work or for specific tasks like credentialing support or denial management. Industry surveys suggest freelance medical billers earn around $34 per hour for general billing, and closer to $48 per hour for more specialized healthcare management tasks, above the typical range. The challenge with hourly billing is that it can be hard to know how many hours a task should actually take.
- Flat Monthly Fee ($1,000–$5,000+): Some billing companies offer flat monthly rates, particularly for practices with predictable volume and relatively straightforward claim types. The risk is that a flat rate may not scale well. A practice that doubles its patient load may find the vendor struggling to keep up or pushing to renegotiate.
Did You Know?
Most providers are paying in one of these models but very few have sat down to calculate the true all-in cost per claim, including the hours their own staff spend on billing-related tasks.
The Hidden Cost of Claim Denials Nobody Talks About:
Any honest accounting of medical billing rates per claim has to include what happens when claims get denied. Right now, denials are a serious and growing problem across the industry.
Here’s the current picture:
In 2025, 41% of providers reported that more than 10% of their claims are denied, up from 30% in 2022Initial claim denial rates hit 11.8% in 2024, up from 10.2% just a few years earlierIndustry data suggests commercial insurer denial rates rose by about 1.5% from 2023 to 2024, with a sharper increase of nearly 5% for Medicare AdvantageProviders collectively spend an estimated $19.7 billion a year fighting denied claims
The cost to rework a denied claim varies significantly by payer type:
| Payer Type | Rework Cost Per Denial | Avg Denial Rate |
|---|---|---|
| Commercial Insurer | $63.76 per claim | 13.9% |
| Medicare Advantage | $47.77 per claim | 15.7% |
| ACA Marketplace | $25–$117 (industry estimate) | ~19% |
If your practice submits 500 claims per month and 10% are denied, that’s 50 claims requiring rework. At $63.76 per rework for commercial payers, you’re looking at about $3,188 in denial management costs monthly, before a single dollar comes in from those reworked claims. Annually, that’s roughly $38,256 in costs tied directly to claims that should have been paid the first time.
Did You Know?
Industry estimates suggest that reworking a single denied claim can cost anywhere from $25 to $117, and that’s before accounting for the claims that are written off and never recovered.
What Drives Billing Costs Up and Down:
Specialty Complexity: Oncology, neurology, cardiology, and other complex specialties end up creating more detailed claims with a larger number of codes per encounter. That means more time spent coding, more risk of mistakes, and more scrutiny from payers.
Payer Mix: If your practice has a heavy concentration of Medicare and Medicaid patients, the billing headaches are different from what they’d be if most of your patients are commercially insured. Government payer billing comes with tight compliance requirements, prior authorization rules, and algorithmic reviews that can flag claims fast, even when there is little human oversight.
Electronic vs. Manual Processes: This might be the single biggest lever for cost. CAQH’s 2024 analysis shows fully electronic workflows bringing claim costs down to about $15, while manual workflows tend to push those costs toward $50. The main driver is labor intensity in manual handling, such as printing, mailing, phone follow-ups, and manual payment posting, which can turn small delays into costly friction.
Denial Prevention vs. Denial Recovery: Practices that invest in clean claims, meaning thorough eligibility verification, accurate coding, and complete documentation before submission, usually spend less on billing overall. Preventing a denial is almost always cheaper than battling one after it happens. Industry data also indicates that up to two-thirds of denials may be recoverable with the right systems in place, but recovery is still more expensive than prevention.
Practice Size and Volume: Larger practices with higher claim volumes often negotiate better rates with billing vendors, and they can spread fixed technology costs across more claims. A solo practitioner sending out 100 claims per month will almost always pay more per claim than a multi-physician group submitting around 2,000.
Benchmarks: What Should You Actually Be Paying?
| Metric | Healthy Range | Requires Attention |
|---|---|---|
| First-pass claim acceptance rate | 95% or higher | Below 90% |
| Denial rate | Under 5% | 10% or above |
| Cost as % of collections | 4%–8% | Above 10% |
| Electronic claim rate | Above 95% | Below 85% |
| A/R days outstanding | Under 35 days | 45+ days |
| Cost per claim (electronic) | $10–$18 | Above $30 |
If your denial rate is consistently above 10%, or your A/R days are creeping past 45, or your billing costs represent more than 10% of collections, those are meaningful signals, not just of billing inefficiency but of revenue walking out the door.
In-House vs. Outsourced Billing: The Real Cost Comparison
One of the most common questions practices grapple with is whether to manage billing internally or hand it to a third-party vendor. The honest answer is that both can work, depending on how it’s done. But the cost math is often more favorable to outsourcing than providers expect.
Real-World Scenario:
A full-time, experienced in-house medical biller typically earns between $45,000 and $65,000 annually in the US. Add benefits (typically 25–30% on top of salary), software subscriptions, training, and management overhead, and you’re often looking at $60,000–$90,000 per year to run a one-person billing operation, before accounting for coverage during vacations, sick days, or turnover.
Industry surveys suggest that around half of providers who outsource billing say it improves accuracy and reduces workload, and about a third expect outsourcing to expand further in 2026.
Questions to Ask Before You Accept Any Billing Rate
Whether you’re reviewing an existing vendor relationship or evaluating new options, these questions should be part of any billing conversation:
- What is your first-pass claim acceptance rate? (Should be 95%+)
- Is denial management included in the base rate or billed separately?
- What percentage of my claims will be submitted electronically?
- Are there setup fees, monthly minimums, or additional charges for specialty claims?
- How do you measure and report on collection performance? How often?
- What is your process for keeping up with payer rule changes and coding updates?
- Who specifically will be working on my account, and what are their credentials?
Any reputable billing operation should be able to answer these questions clearly and without hesitation.
The Bottom Line
Medical billing rates per claim aren’t just a vendor pricing question; they’re a window into the overall health of your revenue cycle. Understanding what you’re paying, what you’re getting, and how your metrics compare to industry benchmarks is one of the most practical things a healthcare provider can do to protect their financial stability.
The difference between a well-managed billing operation and a poorly managed one isn’t always visible on a day-to-day basis. It shows up in A/R reports, in denial trends, in the slow accumulation of write-offs that never get addressed. By the time most practices notice something is wrong, the damage has already compounded.
The goal isn’t to find the cheapest billing rate but to find the rate that gets you the best return on every dollar of care you deliver.
At Vigilant Billing, we help healthcare providers understand exactly what they’re spending per claim, where the revenue is leaking, and how to fix it without overhauling their entire operation. Schedule a free billing audit today.
Sources
CAQH, 2024 CAQH Index Report: https://www.caqh.org/hubfs/Index/2024%20Index%20Report/CAQH_IndexReport_2024_FINAL.pdf
Experian Health, State of Claims 2025: https://www.experian.com/blogs/healthcare/state-of-claims-2025/
Kodiak Solutions, 2024 initial denial rate data (Business Wire, May 2025): https://www.businesswire.com/news/home/20250521892947/en
Premier Inc. claims denial survey, via Fierce Healthcare: https://www.fiercehealthcare.com/providers/providers-wasted-106b-2022-overturning-claims-denials-survey-finds
KFF, HealthCare.gov insurer claims denials in 2023: https://www.kff.org/private-insurance/healthcare-gov-insurers-denied-nearly-1-in-5-in-network-claims-in-2023-but-information-about-reasons-is-limited-in-public-data/